Project Portfolio

Predicting Bay Area Crime via Machine Learning
As a recent Bay Area transplant, I wanted to explore crime rates around the Bay Area, how crime rates have evolved over time, and which factors are most associated with higher crime areas vs lower crime areas.
This project involved collecting data from the US Census Bureau and the CA DOJ crime database (reported by the FBI) to analyze crime rates at a geographic level, investigating socioeconomic factors associated with higher crime rate areas, and training a Random Forest classifier to classify a geography as high-crime or non high-crime based on socioeconomic/demographic factors.
Achieved precision of 88% and recall of 74% in predicting a high-crime geography.
Built using Python and Jupyter.
Analysis of CMS Part D Spending
After spending some time working in healthcare consulting, I wanted to apply my analytics expertise by seeking out and analyzing publicly available healthcare data. I came across the “Medicare Part D Spending by Drug” database published by CMS annually, and decided to do some analysis to uncover any useful trends that could help me in my role.
Key Findings:
- CMS spend across all Part D drugs was over $180 billion in 2019, a 37% increase from 2015
- Blood thinner Eliquis from Bristol Myers Squibb led in total Part D spend in 2019 with over $7.3 billion in spend
- Novo Nordisk, a leader in the diabetes space, led in overall 2019 CMS spend at $9.5 billion


US Brewery Analysis & Visual Dashboard
An avid enjoyer of craft beer, I wanted to explore data around breweries and award-winning brews around the nation.
I used Python to scrape over 150 web pages containing brewery data across all 50 states, as well as Great American Beer Festival 2023 award winners to compile a custom US brewery dataset. I developed a dashboard showing the geographic distribution of America’s breweries, showcasing 2023 medalists and the beers that won the gold (and silver and bronze too).
Data collected using Python (BeautifulSoup), dashboard created and published on Tableau Public.
Identifying the Optimal Location for a New San Diego Restaurant via K Means Clustering
The objective of this project was to identify the most desirable neighborhood in the city of San Diego, CA to open up a new Mexican restaurant using K Means clustering.
I collected and aggregated data from a variety of publicly available sources, including demographic and geospatial data from the City of San Diego Data Portal, and venue data from Foursquare’s API.
Using data points such as average resident income, age, and number of existing Mexican restaurants, I segmented San Diego’s neighborhoods using K Means clustering and a proprietary scoring methodology to identify the optimal neighborhoods in which to open a new Mexican restaurant.
Built using Python and Jupyter.


Sales and Customer Segmentation Dashboard for Local Small Business
A friend of mine runs a family business in a small coastal California town.
For several years I have assisted their business by conducting ad hoc analyses and developing BI dashboards, including a sales dashboard and customer segmentation dashboard that segments customers into archetypes based on their purchasing behavior.
My analyses and BI tools have helped this small business identify top selling items/categories, track sales trends over time, and identify key customer segments for promotional strategies (e.g., customer loyalty program), driving 50% YoY sales growth.
Clinical Trial Navigator Web Application
Web Application: www.fabiovillagran.pythonanywhere.com
CLI Tool: https://github.com/fabiovillagran/clin_trial_navigator
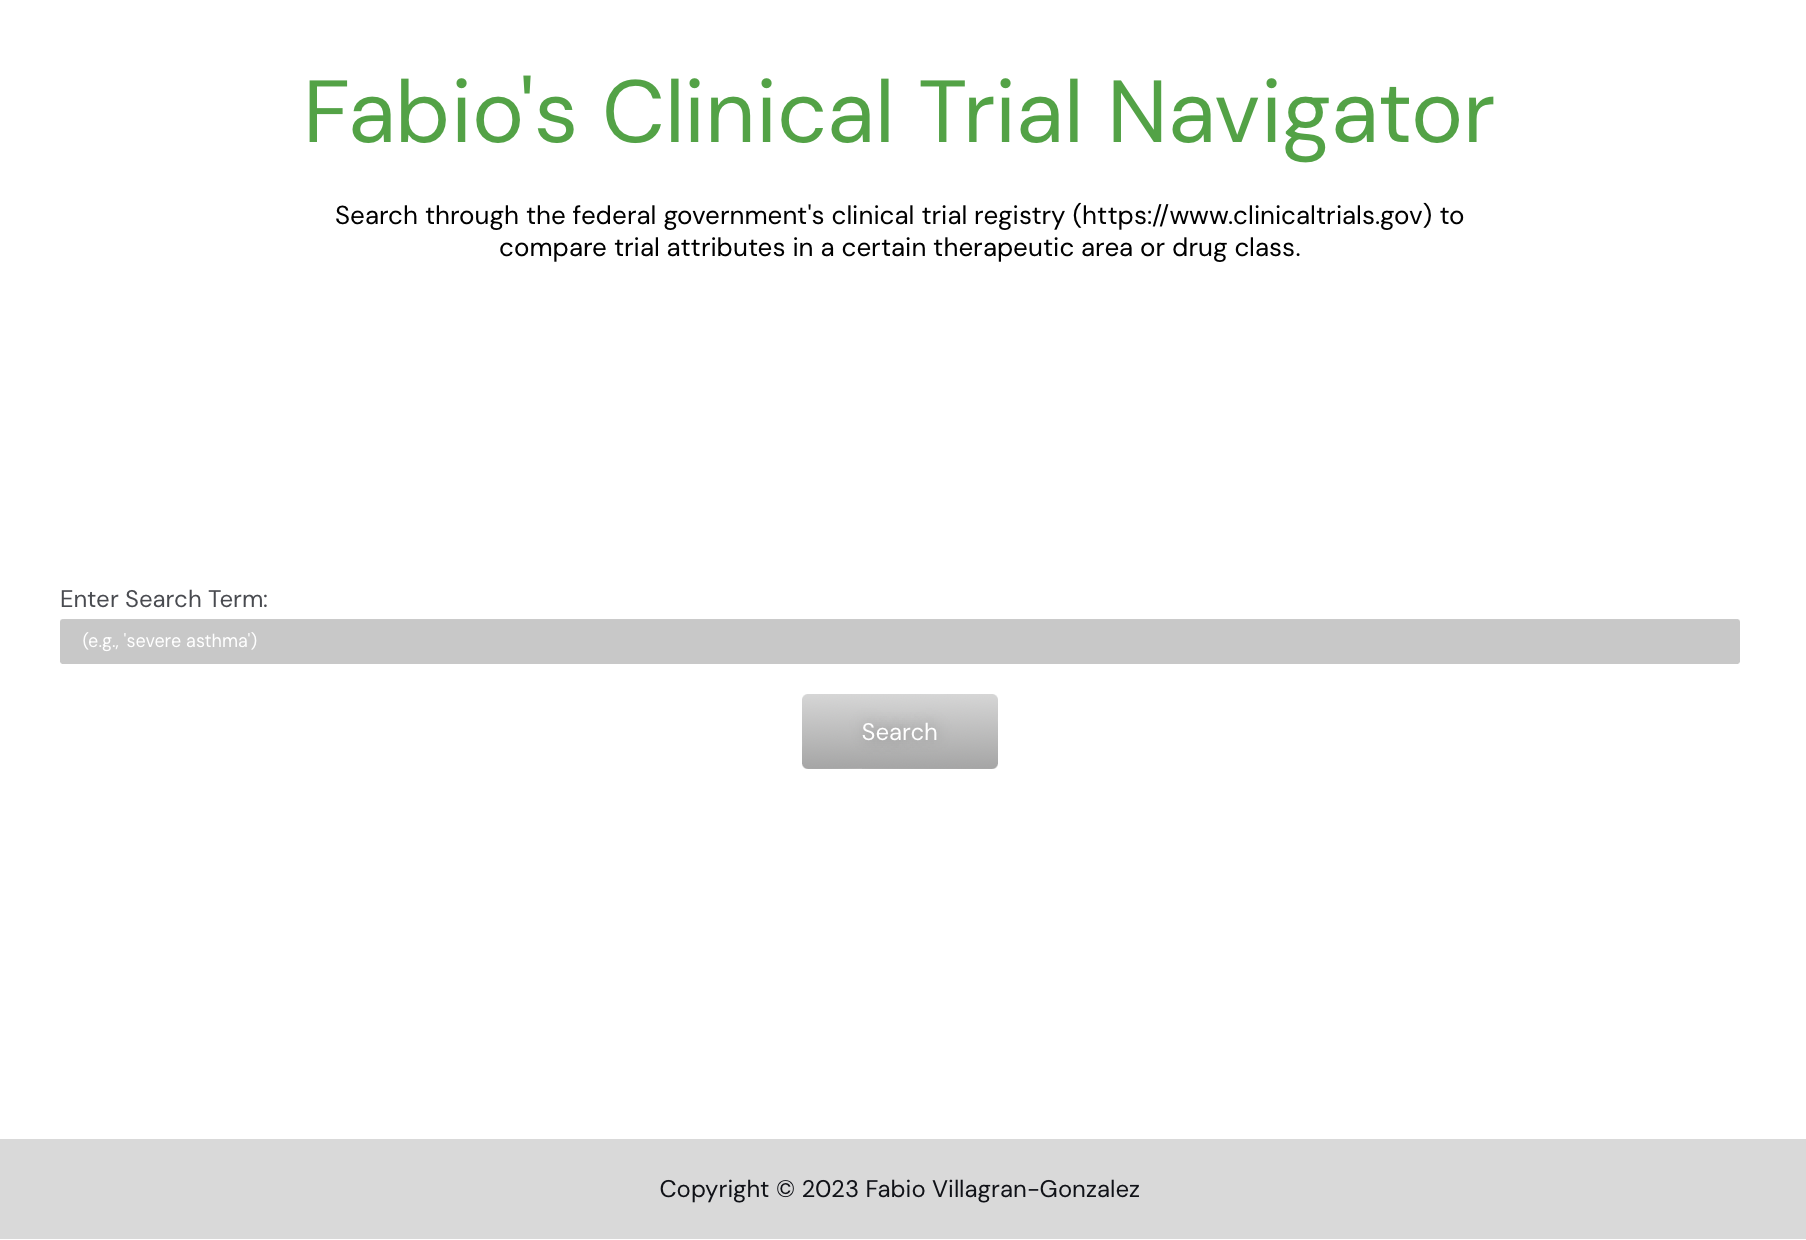
A simple, user-friendly online tool that allows users to input a search term or expression, then queries clinicaltrials.gov’s API and returns a clean searchable table of results containing key data points of interest.
My prior consulting work involved scouring clinical trials and extracting + analyzing key data points from trials of interest (e.g., population inclusion/exclusion criteria, primary/secondary endpoints, comparator agents, etc.). Traditionally a laborious manual process, this tool allows for quick and easy research and download of an analysis-ready table of clinical trial key data points.
Built using Python/Django, deployed on PythonAnywhere.


Business Automation Tools
Survey Data Analysis & Presentation Builder
- A Python script that inputs raw survey response data (.CSV) and a blank .PPT template, uses text recognition to classify questions into key archetypes, builds custom output slides visualizing the survey data according to question archetype including key question text, and combines the slides into a complete presentation with custom title, subtitle and file name.
Market Research Data Capture Sheet Builder
- A Python script that inputs a market research discussion guide in MS Word (.DOC) format, uses text recognition to classify questions into key archetypes, and outputs a Data Capture Sheet in MS Excel format, formatted according to question archetype, with conditional formatting and formulaic logic built-in for immediate market research usability